NCARB’s 2019 report features new data on the path to architectural licensure
The release of the National Council of Architectural Registration Boards’ (NCARB) annual data report, NCARB by the Numbers, provides new insights into the makeup of candidates and metrics relating to the pursuit of architectural licensure. The 2019 edition reveals updates regarding the number of U.S. architects, the time it takes to earn a license, diversity in the profession, analysis on attrition along the path to licensure, and a look-back at historical data celebrating the organization’s 100 year history.

For the first time, the 2019 NCARB by the Numbers includes exclusive data—gathered in partnership with Benenson Strategy Group—exploring the public perception of licensure and regulation.
Key findings from the latest edition, which is based on data from the 2018 calendar year, include several record setting or near-record statistics:
- In 2018, nearly 5,000 candidates completed their core licensure requirements—slightly fewer than in 2017, but still higher than almost any other year on record.
- For the first time, over half of newly licensed architects started their NCARB Record while in school.
- Nearly 5,000 candidates completed the Architect Registration Examination® (ARE®) in 2018, the second highest number on record.
- Gender equity improved along most career stages. Women now make up 50 percent of candidates beginning the AXP, the first time equity has been seen at any career stage.
- Diversity continues to improve along early career stages—46 percent of new AXP candidates and 35 percent of new ARE candidates now identify as non-white.
- Historic differences in attrition between men and women have disappeared since 2012; men and women now remain on the path to licensure at equal rates.
- Non-white candidates are at least 25 percent more likely to stop pursuing licensure than white candidates.
- Over 6,000 licensure candidates completed the Architectural Experience Program® (AXP)® in 2018—a drop, but still well above the decade’s average of 5,290.
- On average, candidates take 4.2 years to complete the AXP.
- Sixty-three percent of candidates overlap their experience and exams—a factor that can shave several years off the time to licensure.
- On average, it takes 12.8 years to complete the core licensure requirements, which include earning a degree, completing the experience program, and passing the ARE.
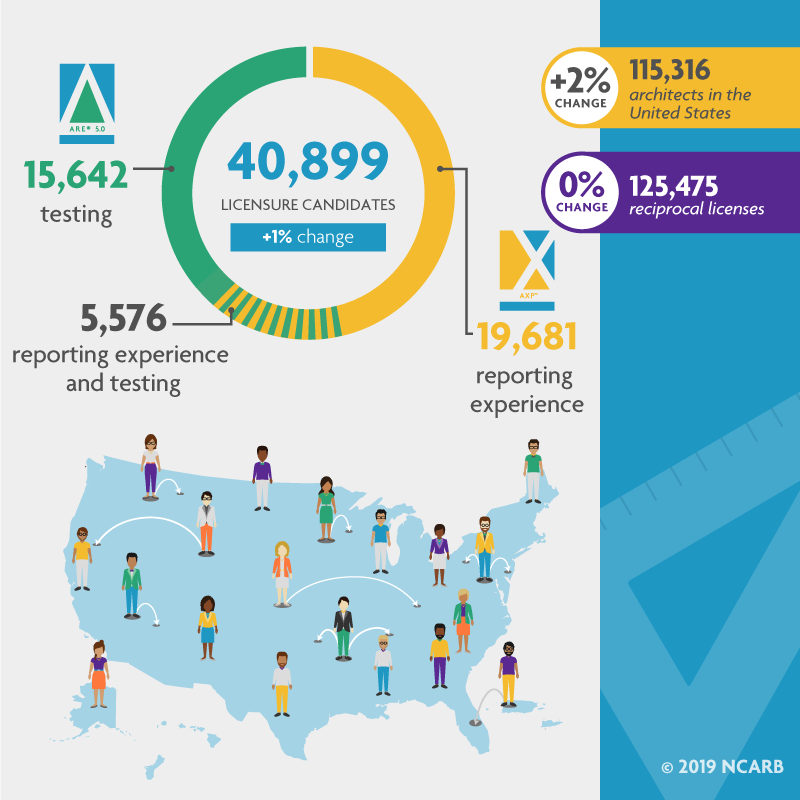
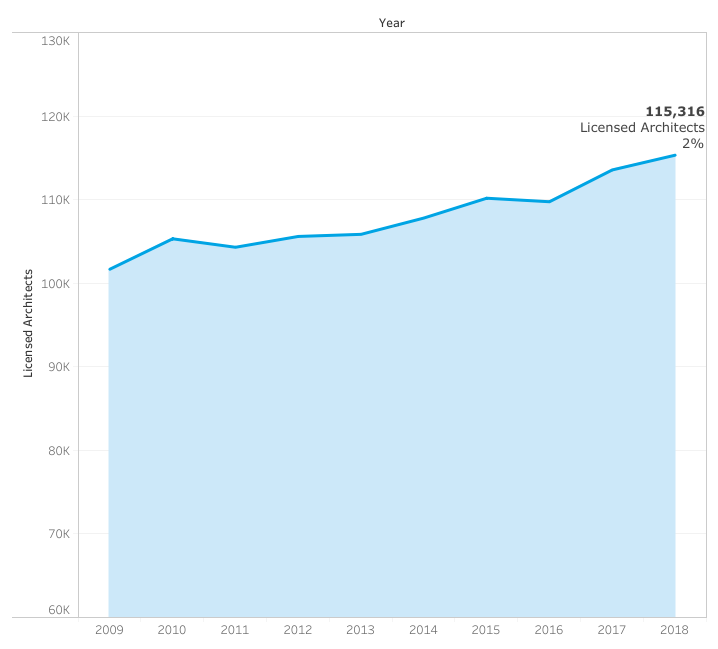
- In 2018, there were 115,316 architects in the United States—a 2 percent increase from 2017.

- Over a 10-year period, three out of every five candidates stay on the path to licensure.
“In May 2019, NCARB celebrated its 100th anniversary as an organization, founded by state licensing boards desiring consistent rigor and mobility across state boundaries” said NCARB CEO Michael Armstrong. “As we embark on our second century, we will continue using the information gathered in NCARB by the Numbers, as well as insight from our members, customers, volunteers, and the public, to respond to the opportunities and challenges facing the future of licensure.”
The Benenson survey on public perception of licensure and regulation involved nearly 1,000 registered voters. Those participants revealed that seventy-six percent of the public agree professional licensing makes consumers feel safe, and 88 percent believe architects should be regulated. Additional data on public perception will be released later this year.
The findings in NCARB by the Numbers are pulled from the Council’s database of over 115,000 licensure candidates and NCARB-certified architects, making this annual report the most comprehensive source available for licensure statistics.
To read the full report, explore interactive data charts, and download infographics, visit www.ncarb.org/NBTN2019.


