Native plants, outdoor yoga spaces and charging stations are hot for 2018.
4/3/2018—People want to do downward-facing dogs in their sustainably designed backyards or shared outdoor spaces—while their phones are charging nearby. That is one of the possible conclusions of the 2018 Residential Landscape Architecture Trends Survey conducted by the American Society of Landscape Architects (ASLA).
Landscape architects were asked to rate the expected popularity of a variety of residential outdoor design elements in 2018. The survey was fielded February 22 through March 8, 2018, with 808 responding.
ASLA revised the survey this year to include new types of outdoor amenities that appeal to both single-family and multi-family owners and residents. Residential design is the largest market sector for the landscape architecture profession. Most of that work consists of single-family homes but also includes multi-family and retirement communities.
Because of this change in the survey, flexible outdoor spaces for such activities as yoga and outdoor movie nights as well as charging stations for mobile devices entered the top ten project types for the first time.
Here are the top ten project types with the expected highest consumer demand:
• Native plants – 83.3%
• Native/adapted drought tolerant plants – 83.0%
• Low-maintenance landscapes – 80.0%
• Flexible use space (for yoga classes, movie night, etc.) – 74.2%
• Drip/water-efficient irrigation – 72.4%
• Permeable paving – 74.0%
• Rain gardens – 71.2%
• Reduced lawn area – 70.8%
• Food/vegetable gardens (including orchards, vineyards, etc.) – 70.5%
• Charging stations (mobile devices) – 70.0%
This lineup is virtually unchanged from 2017 except for the additions of flexible-use space and charging stations.
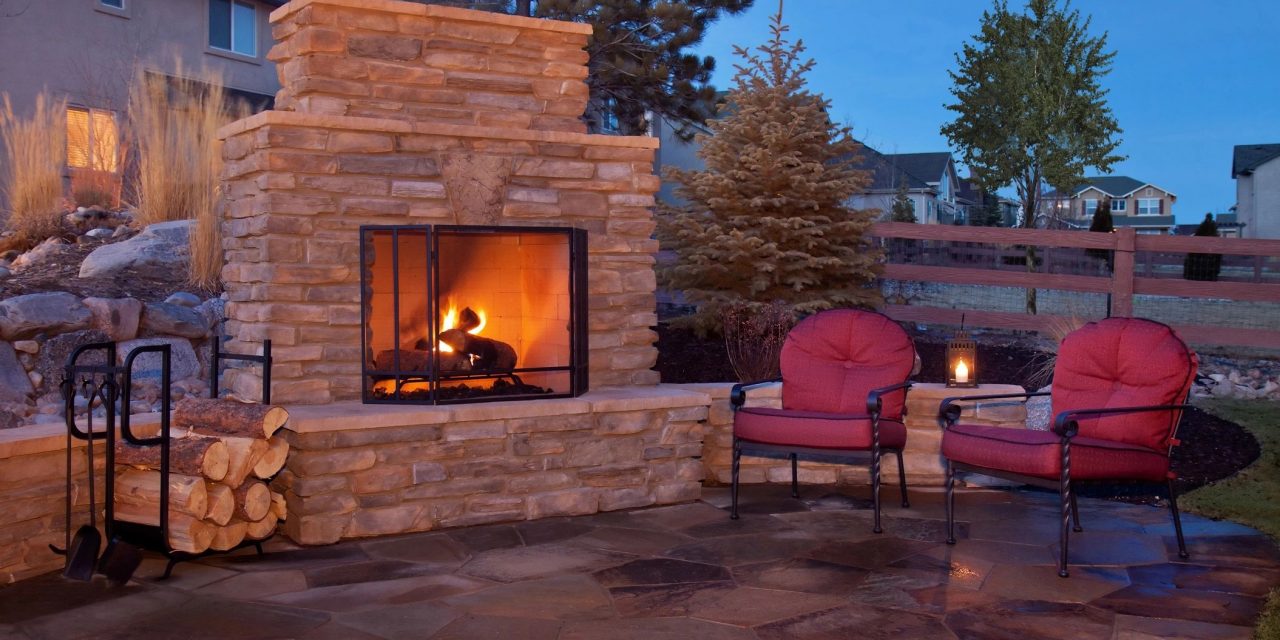
The top three most popular outdoor design elements include fire pits/ fireplaces (66.0 percent), lighting (65.4 percent) and seating/dining areas (64.0 percent). Last year’s top three were fire pits/fireplaces (71.5 percent), wireless/internet connectivity (70.8 percent) and lighting (67.8 percent). Wireless/internet connectivity was grouped this year with movies, TV, and video theaters and stereo systems, a lineup that received 48.0 percent of the vote in the outdoor design elements category.
The top landscape and garden elements are expected to include native plants (83.3 percent), low-maintenance landscapes (80.0 percent) and rain gardens (71.2 percent). In 2017 the top three were native plants (81.6 percent), low-maintenance landscapes (79.3 percent) and food/vegetable gardens (76.5 percent).
Enhanced railing systems, which include those with cable or glass, is a new answer choice added to the outdoor structure category this year. It is ranked first in this category (51.0 percent), followed by pergolas (48.3 percent) and decks (42.8 percent). Last year, the top three were pergolas (50.3 percent), decks (41.4 percent) and fencing (39.8 percent).
The hottest sustainable design elements include native/adapted drought tolerant plants (83.0 percent), permeable paving (74.0 percent) and drip/water-efficient irrigation (72.4 percent). Last year’s top three in this category were almost the same: native/adapted drought tolerant plants (82.3 percent), permeable paving (76.3 percent) and reduced lawn area (72.7 percent).
The outdoor recreation amenities category has been revised this year to include amenity types for both single-family and multi-family residences. Sports courts were broken down into more specific types and labyrinths were removed. The top three types in 2018 include dog-related recreation areas (68.0 percent), designated areas for other outdoor recreation (61.5 percent) and bocce courts (42.5 percent). Last year’s top three in this category were sports courts (42.4 percent), spa features (39.7 percent) and swimming pools (39.2 percent).
ASLA added a new question about multi-family outdoor amenities this year. The top three trends for this category include flexible use space (for yoga classes, movie night, etc.) (74.2 percent), charging stations (mobile devices) (70.0 percent) and bike storage (69.9 percent).
Outdoor Design Elements
Ranked in expected order of popularity for 2018
Fire pits/ fireplaces – 66.0%
Lighting – 65.4%
Seating/dining areas – 64.0%
Outdoor furniture – 59.1%
Outdoor kitchens – 58.8%
Decking (i.e., rooftop decking, etc.) – 53.6%
Grills – 50.0%
Movie/TV/video theaters, wireless/internet, stereo systems – 48.0%
Outdoor heaters – 40.5%
Stereo systems – 36.9%
Pools and spa features (hot tubs, Jacuzzis, whirlpools, indoor/outdoor saunas) – 36.9%
Utility Storage – 32.3%
Hammocks – 29.2%
Outdoor cooling systems (including fans) – 28.5%
Showers/baths – 22.9%
Outdoor Recreation Amenities (Single Family and Multi-Family Residences)
Ranked in expected order of popularity for 2018
Dog-related recreation area – 68.0%
Designated area for other outdoor recreation – 61.5%
Bocce courts – 42.5%
Swimming pools – 36.8%
Pickleball courts – 30.0%
Hot tubs/whirlpools/Jacuzzis – 29.3%
Outdoor gym – 28.6
Lap pools – 27.2%
Basketball courts – 16.6%
Paddle tennis courts – 14.2%
Lawn croquet – 13.9%
Saunas – 11.8%
Tennis courts – 9.1%
Multi-Family Outdoor Amenities
Ranked in expected order of popularity for 2018
Flexible use space (for yoga classes, movie night, etc.) – 74.2%
Charging stations (mobile devices) – 70.0%
Bike storage – 69.9%
Play area for children – 57.7%
Water feature (aesthetic feature, not pool) – 46.5%
Bike repair station – 45.9%
Transit screen (updates on public transit) – 39.1%
Pet spa – 32.1%
Plunge pool – 18.6%
Landscape/Garden Elements
Ranked in expected order of popularity for 2018
Native plants – 83.3%
Low-maintenance landscapes – 80.0%
Rain gardens – 71.2%
Food/vegetable gardens (including orchards, vineyards, etc.) – 70.6%
Water-saving xeriscape or dry gardens – 65.9
Organic gardens – 59.6%
Rooftop gardens – 53.4%
Plant walls/vertical gardens – 53.0%
Planters, sculptures, garden accessories – 48.4%
Decorative water elements (ornamental pools, fountains, splash pools, waterfalls, grottos, water runnels or bubblers) – 42.6%
Ponds/streams – 28.6%
Formal gardens – 15.2%
Outdoor Structures
Ranked in expected order of popularity for 2018
Enhanced railing systems (cable, glass, etc.) – 51.0%
Pergolas – 48.3%
Decks – 42.8%
Fencing – 41.5%
ADA Accessible structures (ramps, bars, shelving, etc.) – 39.9%
Arbors – 37.4%
Play structures (tree houses, swing sets, etc.) – 34.1%
Porches – 32.6%
Pavilions – 32.6%
Utility sheds (tool sheds, garden sheds) – 30.0%
Gazebos – 21.0%
Sustainable Elements
Ranked in expected order of popularity for 2018
Native/adapted drought tolerant plants – 83.0%
Permeable paving – 74.0%
Drip/water-efficient irrigation – 72.4%
Reduced lawn area – 70.8%
Rainwater/graywater harvesting – 68.7%
Recycled materials – 63.6%
Solar-powered lights – 60.4%
Compost bins – 47.2%
Geothermal heated pools – 21.3%
About the American Society of Landscape Architects
Founded in 1899, the American Society of Landscape Architects (ASLA) is the professional association for landscape architects in the United States, representing more than 15,000 members. The Society’s mission is to advance landscape architecture through advocacy, communication, education and fellowship. Sustainability has been part of ASLA’s mission since its founding and is an overarching value that informs all of the Society’s programs and operations. ASLA has been a leader in demonstrating the benefits of green infrastructure and resilient development practices through the creation of its own green roof, co-development of the SITES® Rating System, and the creation of publicly accessible sustainable design resources.


