Nonresidential building pulls back from October’s brisk pace
NEW YORK – December 20, 2018 – At a seasonally adjusted annual rate of $789.3 billion, new construction starts in November decreased 7% from October’s elevated amount, according to Dodge Data & Analytics. Most of the total construction decline in the latest month was the result of nonresidential building pulling back 15% after its 43% surge in October. There were eight very large projects with a value of $500 million or more (totaling $7.4 billion) that boosted nonresidential building in October. In contrast, there were just three very large projects with a value of $500 million or more (totaling $2.8 billion) that were entered as nonresidential building starts in November.
The other two major construction sectors witnessed slightly reduced activity in November, with residential building down 1% and nonbuilding construction down 2%. During the January-November period of 2018, total construction starts on an unadjusted basis were $738.2 billion, up 1% from a year ago. Excluding the electric utility/gas plant category, which fell 30% year-to-date, total construction starts in the first eleven months of 2018 were up 2%.

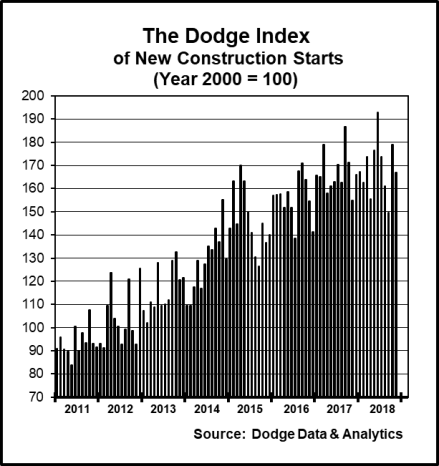
November’s data produced a reading of 167 for the Dodge Index (2000=100), down from a revised 179 for October and returning the Index to a level closer to the 166 average for the full year 2017. Through the first eleven months of 2018, the Dodge Index averaged 169. “Amidst the monthly ups-and-downs, the construction start statistics show that on balance the construction industry expansion was still underway in 2018, although the rate of growth has slowed considerably from the 7% gains for total construction reported during 2016 and 2017,” stated Robert A. Murray, chief economist for Dodge Data & Analytics.

“Several features stand out about the pattern of construction starts during 2018,” Murray continued. “Nonresidential building through eleven months has stayed within 2% of the enhanced activity registered during 2017, reflecting a varied performance by project type. The commercial building segment revealed more growth in dollar terms for hotels and office buildings, with the latter boosted by the start of such projects as the $1.8 billion Spiral office tower in New York NY, a $665 million office tower on North Wacker Drive in Chicago IL, as well as several massive data center projects. The institutional building segment has benefited from more growth for educational facilities and amusement-related projects, but transportation terminal starts have settled back from an exceptional amount in 2017 to what’s still a healthy volume in 2018. Manufacturing plant construction has shown wide swings month-to-month, yet for 2018 as a whole this project type continues to trend upward. With regard to residential building, multifamily housing has seen renewed growth in 2018 after its loss of momentum in 2017, but single family housing has essentially plateaued following the advances registered at the outset of 2018. For nonbuilding construction, the public works segment has shown growth for highways and bridges, helped by the 2018 federal omnibus appropriations bill passed back in March, although pipeline construction starts have eased back from a robust 2017. New electric utility/gas plant starts, despite the occasional jump such as reported in November, have continued to trend downward over the course of 2018.”
Nonresidential building
Nonresidential building in November was $279.9 billion (annual rate), down 15% from October. The manufacturing plant category plunged 71% from an October amount that was boosted by a $1.6 billion natural gas processing plant in Douglas WY, as well as a $400 million wood products plant in Lexington NC, a $400 million natural gas processing plant in Watford City ND, and a $320 million biofuel refinery in Lakeview OR. The largest manufacturing plant projects entered as November construction starts were a $213 million cheese processing plant in St. Johns MI and a $120 million steel mill in Sedalia MO.
- The institutional building categories as a group dropped 23% in November after registering a 32% hike in October.
- The transportation terminal category plunged 73% from October that included the start of the $1.4 billion Terminal One building at Newark Liberty International Airport and a $655 million concourse expansion project at Denver International Airport.
- Amusement-related work dropped 18% from October that included groundbreaking for the $860 million expansion of the Las Vegas Convention Center in Las Vegas easing the amusement category’s November decline were the start of two additional large projects in Las Vegas NV – the $450 million Madison Square Garden Sphere performance venue and the $323 million Caesar’s Forum Convention and Meeting Center.
- Decreased activity in November was also reported for healthcare facilities, down 8%; and public buildings, down 49%; while the church construction category ran counter with a 45% jump after a very weak October.
- Educational facilities, the largest institutional building category, retreated 6% in November despite groundbreaking for the $164 million Dayton Avenue elementary and middle school campus in Passaic NJ and a $140 million addition to the W.K. Kellogg Institute and Dental Building at the University of Michigan in Ann Arbor MI.
The commercial categories as a group climbed 14% in November, on top of the 47% increase that was reported in October, with much of the November boost coming from the start of the $1.5 billion Manchester Pacific Gateway complex in San Diego CA that includes two hotels, four office buildings, a parking garage, retail space, and museum space.
Hotel construction in November advanced 22%, benefiting from the start of a $573 million convention center hotel and a $70 million boutique hotel at the Manchester Pacific Gateway complex, as well as the start of the $241 million Omni Hotel in Oklahoma City OK and the $112 million hotel portion of the $200 million Harrah’s Cherokee Casino Hotel/Convention Center expansion in Cherokee NC. The office building category in November receded just 2% after soaring 121% in October, as that month reflected the lift coming from such projects as the $644 million office portion of the $1.3 billion Winthrop Square Tower in Boston. In November the office category included four office buildings at the
Manchester Pacific Gateway complex valued at a combined $544 million, plus the start of a $750 million Facebook data center in Covington GA, a $530 million California state office building in Sacramento CA, and a $300 million Google data center in Henderson NV. Store construction in November grew 26%, aided by $76 million estimated for retail space at the Manchester Pacific Gateway complex, and the commercial garage category rose 24% with the help of the $174 million garage portion of the Manchester Pacific Gateway complex. Warehouse construction in November advanced 43%, featuring the start of a $200 million warehouse center in Ontario CA and three Amazon distribution centers located in Charlotte NC ($167 million), Garner NC ($166 million), and Las Vegas NV ($92 million).
Through the first eleven months of 2018, nonresidential building was down 2% compared to the same period a year ago. The institutional building group retreated 8% year-to-date after jumping 19% during the first eleven months of 2017, with reduced activity reported this year for transportation terminals, down 44%; church construction, down 24%; healthcare facilities, down 10%; and public buildings, down 1%. The commercial building group increased 1% year-to-date, with gains for office buildings, up 14%; and hotel construction, up 13%; but declines for commercial garages, down 1%; warehouses, down 7%; and store construction, down 23%. The manufacturing plant category year-to-date increased 19%.
Residential building
Residential building in November was $327.5 billion (annual rate), down 1% from October. Single family housing was unchanged from its October pace, staying basically at the plateau that’s been present for much of 2018. Multifamily housing receded 3% in November following its 20% rise in October. There were ten multifamily projects valued at $100 million or more that reached groundbreaking in November, compared to 13 such projects in October. The large multifamily projects in November included the $215 million Victory Park Apartments in Dallas TX, the $200 million Spring Street North block development in Seattle WA, and the $160 million multifamily portion of a $190 million mixed-use development in Philadelphia PA. The top five metropolitan areas ranked by the dollar amount of multifamily starts in November were – New York NY, Washington DC, Boston MA, Los Angeles CA, and Seattle WA.
During the January-November period of 2018, residential building increased 6% compared to last year. Single family housing advanced 6%, showing some deceleration relative to the 9% gain reported during the first eleven months of 2017. By major region, this was the 2018 year-to-date pattern for the dollar amount of single family housing – the West, up 10%; the South Atlantic, up 6%; the South Central, up 5%; the Midwest, up 2%; and the Northeast, unchanged from its 2017 amount. Multifamily housing climbed 8% year-to-date, rebounding after the 7% decline reported during the first eleven months of 2017. Through the first eleven months of 2018, the top five metropolitan areas ranked by the dollar amount of multifamily starts, with their percent change from a year ago, were – New York NY, up 3%; Boston MA, up 80%; Washington DC, up 28%; Miami FL, up 46%; and Seattle WA, up 29%. Metropolitan areas ranked 6 through 10 were – Los Angeles CA, down 25%; San Francisco CA, up 20%; Dallas-Ft. Worth TX, up 33%; Atlanta GA, down 17%; and Philadelphia PA, unchanged from its 2017 amount.
Nonbuilding construction
Nonbuilding construction in November was $182.0 billion (annual rate), down 2% from October. The public works categories as a group retreated 27% after rising 12% over the previous three months.
Highway and bridge construction fell 33% following a 28% hike in October that featured the start of the $1.3 billion U.S. portion of the Gordie Howe International Bridge connecting Detroit MI and Windsor Ontario, as well as the $802 million I-395 project in Miami FL. The largest highway and bridge projects entered as November starts were the $274 million replacement of the upper roadways of the Queensboro Bridge in New York NY and the $231 million reconstruction of I-75 in Troy MI.
The miscellaneous public works category, which includes pipelines and rail transit projects, dropped 51% from October that included the start of the $2.0 billion Gray Oak oil pipeline which will transport crude oil from the Permian Basin to the Corpus Christi TX area. River/harbor development also weakened in November, sliding 21%.
On the plus side for public works, sewer construction climbed 78% in November, while water supply construction improved 26% with the lift coming from a $320 million water treatment plant in the Denver CO area. The nonbuilding construction total in November was supported by a 179% jump for the electric utility/gas plant category, following a lackluster amount in October. Large electric utility/gas plant projects that were entered as November construction starts were a $3.0 billion liquefied natural gas export terminal in the Corpus Christi TX area and a $1.5 billion expansion of a natural gas liquids fractionators plant in the Houston TX area.
During the first eleven months of 2018, nonbuilding construction was down 3% from the same period a year ago. The downward pull came from the 30% year-to-date plunge for the electric utility/gas plant category, which is on track for the third substantial yearly decline in a row after the exceptionally strong amount reported back in 2015. The public works categories as a group were able to register a 2% year-to-date gain. Highway and bridge construction increased 9% year-to-date, exceeding the 8% advance reported during the first eleven months of 2017. The top five states ranked by the dollar amount of highway and bridge construction starts during this year’s January-November period, with their percent change from a year ago, were – Texas, up 42%; California, up 40%; Florida, up 11%; New York, up 5%; and Pennsylvania, up 5%.
Two of the three environmental public works categories registered year-to-gains, with river/harbor development up 16% and sewer construction up 5%, but water supply construction slipped 5%. The miscellaneous public works category retreated 10% year-to-date, after posting a 39% hike during the first eleven months of 2017.
The 1% increase for total construction starts at the national level during the first eleven months of 2018 was the result of a mixed performance by geography. Four of the five major regions were able to post year-to-date gains – the South Central, up 12%; the Midwest and South Atlantic, each up 3%; and the West, up 2%. The Northeast was the one major region to post a year-to-date decline, falling 16%, which reflected the comparison to a very strong amount during the first eleven months of 2017 that included such construction starts as the $7.6 billion LaGuardia Airport project in Queens NY, a $5.8 billion ethane cracker facility in Monaca PA, and the $1.7 billion 50 Hudson Yards office tower in New York NY.


