

A ranking of the top U.S. metropolitan areas by the dollar amount of construction starts for commercial and multifamily buildings shows that the New York NY metropolitan area continued to lead the nation during the first half of 2016, according to Dodge Data & Analytics. However, this year’s volume for New York City, at $13.7 billion, was down 34% from the robust $20.9 billion reported for the same period a year ago. The other metropolitan areas in the top 10 were all able to register sizeable increases compared to last year.
For the metropolitan areas ranked 11 through 20, five showed a greater dollar amount for construction starts during this year’s first half, while five showed declines, including a 44% drop for Houston TX. The national total for commercial and multifamily construction starts during the first half of 2016 was $80.6 billion, down 5% from the volume in last year’s first half, yet still 22% above what was reported during the first half of 2014.
 Rounding out the top five metropolitan areas during the January-June period of 2016, with their percent change from the same period a year ago, were the following – Los Angeles CA, $4.6 billion, up 62%; Chicago IL, $3.6 billion, up 37%; Miami FL, $3.5 billion, up 14%; and Washington DC, $3.2 billion, up 27%. Metropolitan areas ranked 6 through 10 were – Boston MA, $2.9 billion, up 31%; Dallas-Ft. Worth TX, $2.8 billion, up 27%; San Francisco CA, $2.5 billion, up 128%; Atlanta GA, $2.2 billion, up 69%; and Denver CO, $2.0 billion, up 11%.
The commercial and multifamily total is comprised of office buildings, stores, hotels, warehouses, garages and service stations, and multifamily housing. At the national level, the 5% drop for the commercial and multifamily total during the first half of 2016 was the result of similar declines for commercial building, down 5%; and multifamily housing, down 4%. A year earlier, the first half of 2015 had shown substantial gains, with these increases relative to the first half of 2014 – the commercial and multifamily total, up 28%; commercial building, up 20%; and multifamily housing, up 38%.
“Several points can be made to put the moderate decline for first half 2016 commercial and multifamily construction starts at the U.S. level into the proper perspective,” stated Robert A. Murray, chief economist for Dodge Data & Analytics. “First, the comparison is being made against the heightened levels that were reported during the first half of 2015, which were lifted by the start of several unusually large projects. These included nine projects valued at $500 million or more that together summed to $7.6 billion, led by three projects located in New York NY – the $2.5 billion 30 Hudson Yards office-retail building, the $1.2 billion One Manhattan West office tower, and the $840 million 55 Hudson Yards office tower. By contrast, there were only two projects valued at $500 million or more that were included as construction starts during the first half of 2016, namely the $500 million Beverly Center retail renovation in Los Angeles CA and the $500 million One Bennett Park multifamily tower in Chicago IL. If projects valued at $500 million or more are excluded, then commercial and multifamily construction starts in this year’s first half would be up 4%.”
“Second, the New York NY metropolitan area registered an exceptional level of construction starts in the first half of 2015 which was not likely to be sustained. In the first half of 2015, the $20.9 billion of commercial and multifamily construction starts in the New York NY metropolitan area comprised 25% of the national amount, and in the first half of 2016 that share dropped to 17%. During the previous fifteen years, commercial and multifamily construction starts in the New York NY metropolitan area averaged 11% of the national amount. The level of construction starts in the New York NY metropolitan area has recently been supported by luxury multifamily high-rises, the massive Hudson Yards development, foreign investment in New York City real estate, and the push during 2015 by developers to get multifamily projects started prior to the loss of the incentives under the 421-a program, which expired in January 2016.”
 “Third, the pattern of commercial and multifamily construction starts is now showing broader participation geographically. The surge of development in the New York NY metropolitan area has helped to lift the national total so far this decade, including New York’s 67% hike for full year 2015 that raised the annual increase for the nation to 12%. Excluding the New York NY metropolitan area, the 2015 full year increase for the nation would have been just 4%. At the same time, this year’s first half retreat for the New York NY metropolitan area led to the declines at the national level – if the New York NY metropolitan area is excluded, commercial and multifamily construction starts would have shown a 5% increase, with commercial building up 4% and multifamily housing up 6%. Metropolitan areas that had been slow to join the recovery process, such as Los Angeles, Chicago, San Francisco, Atlanta, and Denver, are now seeing considerable gains in 2016 for commercial and multifamily construction starts. Meanwhile, markets such as Miami, Washington DC, Boston, and Dallas-Ft. Worth, which had been early participants in the recovery process, continue to see strengthening activity in 2016. This has outweighed the weaker activity that’s been reported in Houston, adversely affected by the slowdown in the nation’s energy sector, as well as by the first half 2016 pullback for several tech-related markets such as Seattle, Austin, and San Jose following their elevated performance in 2014 and 2015.”
“Fourth, while the environment for commercial and multifamily construction may not be quite as favorable as in recent years, there are still positive factors that should support development. According to the quarterly survey of bank lending officers conducted by the Federal Reserve, lending standards for commercial real estate loans showed some tightening during the latter half of 2015 that’s continued into 2016. Even so, the Federal Reserve survey indicates that bank lending officers continued to see greater demand for commercial real estate loans during this period. Vacancy rates remain generally low, suggesting that increased construction activity has not yet led to oversupply in most markets. And, the recent improvement in the employment statistics should benefit the demand for multifamily housing and office buildings, especially in those markets that have been slow to join the recovery.”
New York NY
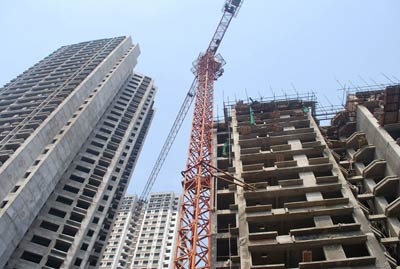
 The 34% decline for the New York NY metropolitan area during the first half of 2016 was the result of diminished activity for both commercial building, down 45%, and multifamily housing, down 26%, from the exceptionally high amounts of a year ago. The first half 2016 levels were still well above the first half of 2014, with the commercial and multifamily total up 37% based on gains of 43% for commercial building and 33% for multifamily housing. In 2015 the first half of the year included seven projects valued at $500 million or more, led by the $2.5 billion 30 Hudson Yards office-retail building. By contrast, the largest project reported as a construction start during the first half of 2016 was a $475 million multifamily high-rise located in Jersey City NJ. The 45% decline for commercial building in the first half of 2016 reflected sharply reduced construction activity for offices and stores, which was offset to a small extent by a 74% jump for hotels. Large hotel projects that reached groundbreaking so far in 2016 were the $205 million Marriott Moxy Hotel and the $109 million Renaissance Hotel. The largest office project that reached groundbreaking so far in 2016 was the $191 million Brooklyn Navy Yard Dock 72 office building. The 26% drop for multifamily construction starts in dollar terms during the first half of 2016 reflected generally less costly projects than last year, as the number of multifamily projects was down just 3% year-to-date.
Los Angeles CA
The Los Angeles CA metropolitan area had a particularly strong first half of 2016, soaring 62% compared to a year ago, with commercial building up 64% and multifamily housing up 60%. Leading the way for the commercial sector was the $500 million retail renovation of the Beverly Center in Los Angeles, followed by the $178 million Broadcom Research and Development Campus in Irvine, a $93 million hotel in West Hollywood, an $81 million office building in Irvine, and the $50 million renovation of the US Bank Tower in Los Angeles. For multifamily housing, there were five projects valued at $100 million or more that reached groundbreaking during the first half of 2016, led by the $493 million multifamily portion of the $600 million Century Plaza in Century City and the $275 million multifamily portion of a $300 million mixed-use development in Los Angeles.
Chicago IL
The 37% increase for the Chicago IL metropolitan area during the first half of 2016 was due to an especially sharp 96% jump for multifamily housing, while the commercial sector receded 2%. There were six multifamily projects valued at $100 million or more that reached groundbreaking, led by the $500 million One Bennett Park high-rise, the $237 million Gallery on Wells high-rise, and the $209 million Alta Roosevelt high-rise. The slight decline for commercial building was due largely to a reduced amount for office construction, which last year included the start of the $500 million 150 North Riverside office tower. The largest office project that reached groundbreaking so far in 2016 was the $223 million CNA Financial headquarters. Other noteworthy commercial projects that reached groundbreaking during the first half of 2016 were the $110 million Evergreen Plaza Mall and the $95 million M&M/Mars Wrigley distribution center.
Miami FL
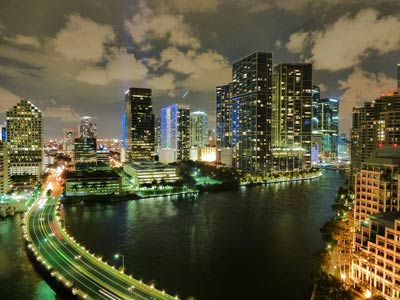 The Miami FL metropolitan area continued to advance during the first half of 2016, with its 14% commercial and multifamily gain reflecting similar increases for multifamily housing, up 14%; and commercial building, up 13%. There were four large multifamily projects that reached groundbreaking – the $305 million Armani/Casa Condominiums, the $243 million Paramount Tower at Miami World Center, the $233 million Gran Paraiso Bay condominium high-rise phase 2, and a $116 million apartment high-rise. Noteworthy commercial projects included the $105 million addition to the Aventura Mall and the $96 million United Technologies Center for Intelligent Buildings.
Washington DC
The Washington DC metropolitan area’s 27% increase for commercial and multifamily construction starts during the first half of 2016 was due to a sharp gain for commercial building, up 99%, which outweighed a 19% drop for multifamily housing. There were five large office projects that reached groundbreaking – the $266 million 655 New York Avenue office building, the $172 million addition to the Fannie Mae office building, a $150 million military office building at Fort Belvoir VA, the $139 million Department of Homeland Security office building (phase 2, involving the adaptive re-use of the Historic Center Building), and the $120 million Capitol Crossing building. Several large hotel projects reached groundbreaking during the first half of 2016, including the $106 million hotel portion of the $230 million Columbia Place hotel and multifamily housing mixed-use facility.
| Top 20 Metropolitan Areas – First Half 2016 | ||||||||
| Commercial Building and Multifamily Housing Construction Starts | ||||||||
| Millions of Dollars, January-June Totals | Percent Change | |||||||
| 2014 | 2015 | 2016 | 2016/2015 | |||||
| 1. | New York-Northern New Jersey-Long Island, NY-NJ-PA | 10,063 | 20,915 | 13,750 | -34 | |||
| 2. | Los Angeles-Long Beach-Santa Ana, CA | 2,993 | 2,849 | 4,612 | +62 | |||
| 3. | Chicago-Naperville-Joliet, IL-IN-WI | 1,531 | 2,666 | 3,645 | +37 | |||
| 4. | Miami-Fort Lauderdale-Miami Beach, FL | 2,138 | 3,043 | 3,465 | +14 | |||
| 5. | Washington-Arlington-Alexandria, DC-VA-MD-WV | 2,894 | 2,544 | 3,224 | +27 | |||
| 6. | Boston-Cambridge-Quincy, MA-NH | 1,874 | 2,248 | 2,939 | +31 | |||
| 7. | Dallas-Fort Worth-Arlington, TX | 1,766 | 2,240 | 2,835 | +27 | |||
| 8. | San Francisco-Oakland-Fremont, CA | 1,181 | 1,083 | 2,474 | +128 | |||
| 9. | Atlanta-Sandy Springs-Marietta, GA | 811 | 1,280 | 2,160 | +69 | |||
| 10. | Denver-Aurora, CO | 1,173 | 1,767 | 1,958 | +11 | |||
| 11. | Seattle-Tacoma-Bellevue, WA | 1,460 | 2,047 | 1,440 | -30 | |||
| 12. | Austin-Round Rock, TX | 953 | 1,527 | 1,255 | -18 | |||
| 13. | Nashville-Davidson-Murfreesboro, TN | 559 | 676 | 1,164 | +72 | |||
| 14. | Phoenix-Mesa-Scottsdale, AZ | 1,419 | 1,096 | 1,128 | +3 | |||
| 15. | Kansas City, MO-KS | 386 | 1,004 | 1,102 | +10 | |||
| 16. | Houston-Baytown-Sugar Land, TX | 2,973 | 1,952 | 1,099 | -44 | |||
| 17. | Philadelphia-Camden-Wilmington, PA-NJ-DE-MD | 1,031 | 1,151 | 957 | -17 | |||
| 18. | Orlando, FL | 522 | 1,251 | 945 | -24 | |||
| 19. | Baltimore-Towson, MD | 588 | 863 | 885 | +3 | |||
| 20. | Riverside-San Bernardino-Ontario, CA | 527 | 756 | 831 | +10 | |||
| Total U.S. | 65,899 | 84,430 | 80,580 | -5 | ||||
| Source: Dodge Data & Analytics | ||||||||
|
|
||||||||
About Dodge Data & Analytics: Dodge Data & Analytics is a technology-driven construction project data, analytics and insights provider. Dodge provides trusted market intelligence that helps construction professionals grow their business, and is redefining and recreating the business tools and processes on which the industry relies. Dodge is creating an integrated platform that unifies and simplifies the design, bid and build process, bringing data on people, projects and products into a single hub for the entire industry, from building product manufacturers to contractors and specialty trades to architects and engineers. The company’s products include Dodge Global Network, Dodge SpecShare, Dodge BuildShare, Dodge MarketShare, and the ConstructionPoints and Sweets family of products. To learn more, visit www.construction.com.
SOURCE Dodge Data & Analytics


